Practice Set 5
This practice set focuses on business analytics functions.
We'll cover the following
Practice Set 5#
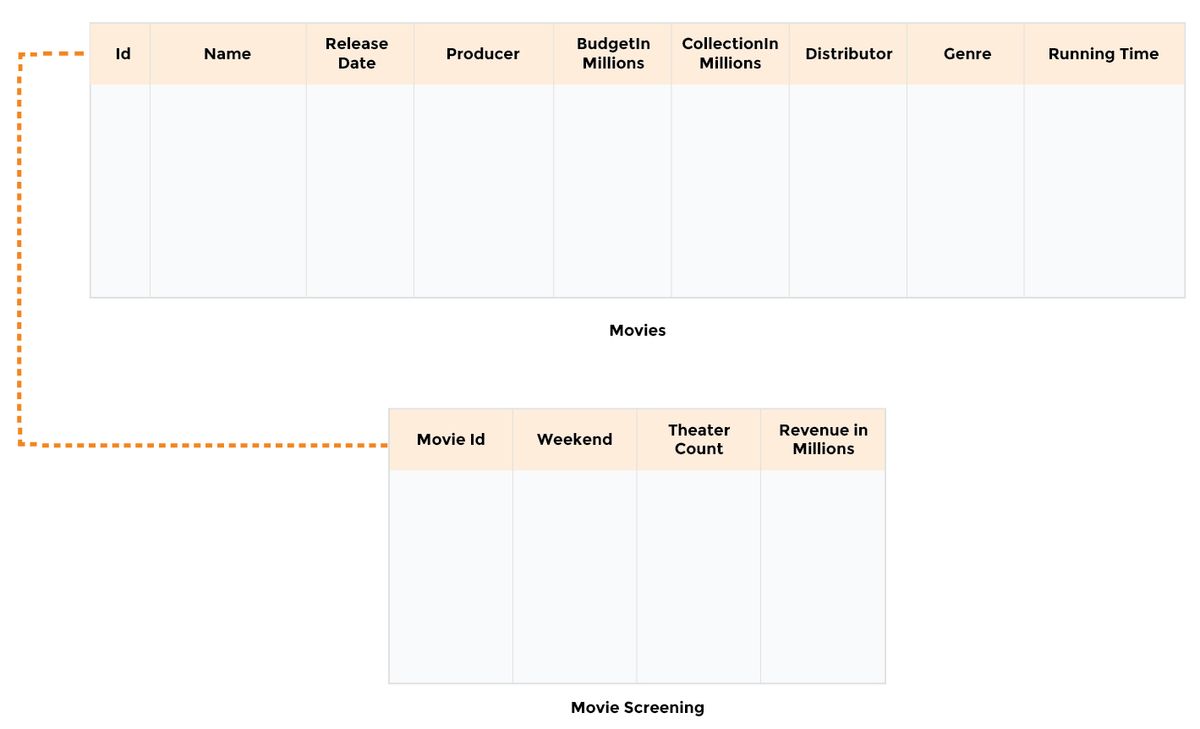
For the purpose of demonstrating analytic functions, we added a new MoviesScreening table and added some columns to the existing Movies table. The relevant portion of the database relationship model is printed below.
Connect to the terminal below by clicking in the widget. Once connected, the command line prompt will show up. Enter or copy and paste the command ./DataJek/Lessons/quiz2.sh and wait for the MySQL prompt to start-up.
Write and execute queries for the following questions:
-
Calculate the running total of the revenue generated per week for the first 10 weeks for the movie Avengers.
Expected Result:
| Date | RevenueInMillions | RunningTotal |
|---|---|---|
| 2019-04-26 | 357.115 | 357.115 |
| 2019-05-03 | 147.383 | 504.498 |
| 2019-05-10 | 63.299 | 576.797 |
| … | … | … |
| … | … | … |
-
Calculate the total revenue of each Genre and find the percentage of revenue of each.
Expected Result:
| Genre | TotalRevenueInMillions | %OfTotalRevenues |
|---|---|---|
| Action | 5105.193 | 86.28 |
| Thriller | 451.187 | 93.90 |
| Reality Television | 300.000 | 98.97 |
| … | … | … |
| … | … | … |
-
Calculate the moving average of revenue generated in a three week window for the movie Ocean’s 11.
Expected Result:
| Weekend | Revenue | 3 Week Total | 3 Week Avg |
|---|---|---|---|
| 2001-12-21 | 14.716 | … | … |
| 2001-12-28 | 16.907 | … | … |
| … | … | … | … |
-
Find the value of RevenueInMillions at the start of each month for the movie Mr. & Mrs. Smith.
Expected Result:
| Date | Month | RevenueInMillions | FirstValue |
|---|---|---|---|
| 2005-06-10 | 6 | 50.34 | 50.34 |
| 2005-06-17 | 6 | 26.04 | 50.34 |
| … | … | … | … |
-
Calculate the monthly growth rate of revenue for the movie Mission Impossible.
Expected Result:
| Month | Total Revenue In Millions | Growth % |
|---|---|---|
| 7 | 61.236 | 0.00 |
| 8 | 80.567 | 31.57 |
| … | … | … |
